IELTS, Writing Task 1
Temperature and rainfall in Brisbane and Canberra: sample answer
A model answer to this exam-style IELTS writing task 1 question, written to a Band 8 target. See the question, the full answer and exactly why it works, then try it yourself.
- Task
- Writing Task 1
- Time
- 20 minutes
- Answer length
- 196 words
- Written to
- Band 8 target
The question
Task
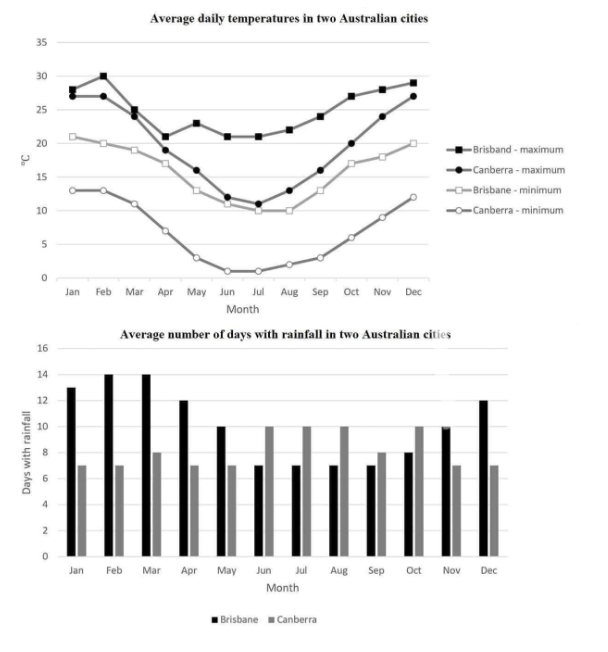
The graph and chart below give information on the average daily maximum and minimum temperatures in degrees Celsius (°C) and the average number of days with rainfall each month for two Australian cities. Write a report for a university lecturer describing the information shown below. Write at least 150 words.
Sample answer
Linking words are highlighted: they show the structure a rater follows.
The line graph shows the average daily maximum and minimum temperatures in Brisbane and Canberra throughout the year, while the bar chart gives the average number of days with rainfall in each month.
Overall, Brisbane was warmer than Canberra all year round and had a narrower temperature range. The cities also had opposite rainfall patterns: Brisbane was wettest in summer, whereas Canberra received rain most often in winter.
In Brisbane, maximum temperatures peaked at 30°C in February and fell to about 21°C between April and July, while minimums ranged from 21°C in January to around 10°C in July and August. Canberra's temperatures varied far more. Its maximums dropped from 27°C in the summer months to a low of 11°C in July, and its minimums fell from 13°C to just 1°C in June and July.
As for rainfall, Brisbane had 13 to 14 rainy days a month from January to March, but this figure fell to just seven from June to September, before rising to 12 in December. Canberra, by contrast, generally had around seven rainy days a month, increasing to ten from June to August and in October.
196 words
Why it works
What you can measure in this answer, and what IELTS examiners mark.
- The right length. 196 words: inside the required 150–200, in 4 paragraphs.
- Clear links between ideas: “whereas”, “while”, “overall”. They make the answer easy to follow, which raters reward under coherence.
- 4 paragraphs, each with its own job, so the reader can follow the answer at a glance.
How IELTS marks writing task 1
- Task AchievementBand 0–9
Answers every part of the task with relevant, well-supported ideas.
- Coherence & CohesionBand 0–9
Logical paragraphs and linking words that guide the reader.
- Lexical ResourceBand 0–9
A range of vocabulary used accurately and naturally.
- Grammatical Range & AccuracyBand 0–9
A mix of simple and complex sentences with few errors.
Common questions
How many words should a IELTS Writing Task 1 answer have?
The task asks for 150 to 200 words, written in 20 minutes. This sample is 196 words.
How is IELTS Writing Task 1 scored?
IELTS marks it on Task Achievement, Coherence & Cohesion, Lexical Resource, Grammatical Range & Accuracy, each on a Band 0 to 9 scale. Your result for the task comes from these together.
Is this a real IELTS question?
No. It's an original, exam-style question written to match the official format. Nobody can legally publish real test questions.
Should I memorise this answer?
No. Use it to see the structure, length and linking words that work, then answer in your own words. Memorised answers rarely fit a new question, and IELTS examiners notice relevant, natural answers.
Where can I practice this question and get a score?
Open it on a2zexams: record or type your own answer and get an instant estimated score on each IELTS criterion, with what to fix. It's free to start.
More Writing Task 1 sample answers
- How a university spends its budgetAllocation of a university's annual budget. Staff salaries 46%, Buildings and maintenance 17%, Research 14%, Student…
- Tourism spending in three regions, 2005 vs 2022The six pie charts below show the proportion of tourism spending allocated to different expenditure categories in three…
- Electricity generation by source, 2000–2025Electricity generated by source, 2000–2025. Coal: 2000 120TWh, 2005 115TWh, 2010 100TWh, 2015 75TWh, 2020 45TWh, 2025…
- Mobile contract costs at four companies, January–September 2002The chart below shows the average cost of a monthly contract for four different mobile (cell phone) companies in a…
- Men and women doing houseworkThe first chart below shows the percentages of women and men in a country involved in some kinds of home tasks…
- University library visits, purposes and time spentThe bar chart shows the number of library visits per month by user type at a university. The pie chart shows the…
Now try a writing task 1 question yourself
Write your answer and get an instant estimated IELTS band with what to fix. Free to start, nothing to install.